Econvillage100 has developed into a market economy. Let’s stay for a moment with the image of a strongly fluctuating share price which is always used in news reports about (turbulent) market trends. A share price represents a PRICE of a share over time. These prices exhibit two important properties which apply to markets in general: they fluctuate over the short or long term and they are observable. The severity of the price fluctuation of a product and over what time these fluctuations take place is dependent on the type of product, whether it is traded on the stock exchange or not, etc. An oil price often features more or less a constant value over a longer time frame. Then it increases or decreases – sometimes quickly, sometimes more slowly – only to even out to a constant world market price once again. Over the long term, it has risen from $5/barrel (1970) to over $100/barrel (2011 & 2012). Since 2015, it has been around $50/barrel.
Of course, not all prices are transparent or observable, for example employment contracts. Nevertheless, we know on average how much a programmer earns or how high a bribe needs to be in certain countries to be seen by a doctor immediately, for example. Evaluating, observing, knowledge of the prices and orientating one’s economic behaviour towards the prices is decisive for the functioning of markets. Every (voluntary) financial business transaction is regulated by prices and this fact is bound to appear in our illustration.
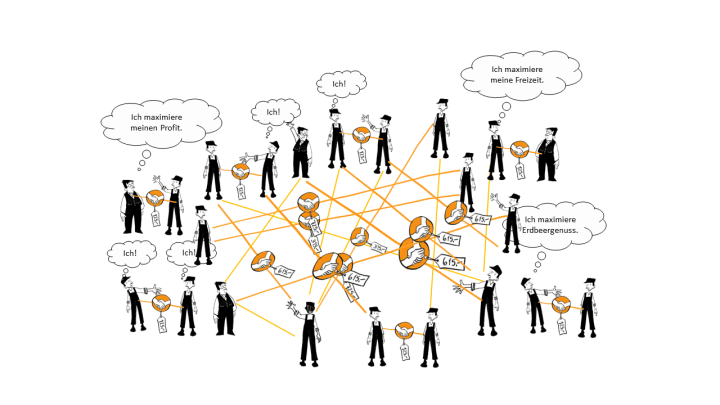
Of course, markets function best when there are lots of producers and lots of consumers, i.e. nobody is exercising market power and everyone is free to choose whether or not to carry out business on the market. Do you now have an image of markets before your eyes? We are making the following suggestion for you in figure 1:
Figure 1: Illustration of the market
The figure shows how many people are taking part in a market. Those with the fatter stomachs represent the producers/providers and those with the caps are the workers/demanders/consumers. They carry out business transactions together – whether it be through the sale of a chocolate bar, the rent on a flat or trading on the stock market. Every completed transaction, represented by a connection and a handshake, carries a visible price tag for all to see. These transactions result in a dense network between the many participants on the market. This enables every individual to decide freely for themselves, within the bounds of their opportunities, which business transactions to make and which not. The observable prices provide guidance and help with decision-making. The transactions which are completed are the ones which provide the greatest joy or, from the point of view of the company, those which promise the greatest profit. This is illustrated with the “Me” and “Maximization” thought bubbles.
And who or what organizes the whole thing? Do you see “something” in the middle? No. The organization of the market simply functions so well because so many people are able to take part in it without the need for a central organization. Markets set incentives to constantly (re-)negotiate the prices of business transactions. In most cases, this does not involve active bartering like on an oriental bazaar (or have you ever tried to negotiate the price of a chocolate bar with the cashier?), but even the decision NOT to buy something directs the economy. It is of course only once there are a lot of non-buyers that the producers need to adapt their prices or quantities or recognize that their product is no longer required on the market. The price, therefore, somehow represents the behaviour of all consumers and providers. There is thus a connection between the individual decision (not) to buy, which is guided by a price, and all other participants on the market.
This was summarized by the first famous economist Adam Smith at the end of the 18th century as the effect of the invisible hand. If it were not invisible, then our illustration of the market would show the threads of the network in its hand at the centre. And now it somehow becomes clear that markets can be sinister when they “get tangled up” from time to time. A culprit naturally cannot be found. It is “simply” a network with lots of price tags.
About the author(s)

Prof. Dr. Johannes Binswanger Professor of Economics
Newsletter
Get the latest articles directly to your inbox.
Share article
More articles
The Future of Work and the Central Role of Diversity & Inclusion
Leadership in Transition: Five Trends of Modern Leadership
The future of work – also relevant for the legal market?
Why inclusive leadership matters for every generation
Do young lawyers need leadership, too? Classification according to generations – slightly arbitrary, but useful


